We want to hear from you! Take the survey.
How do you use It’s Your Yale? How can it be improved? Answer for a chance to win Yale swag.
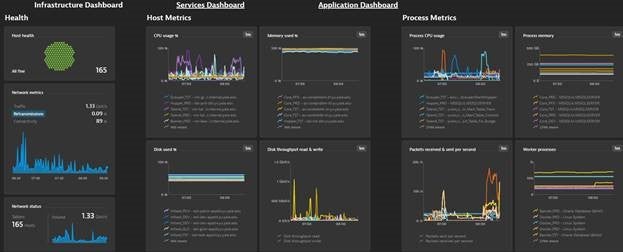
Dynatrace offers system and application owners a single source of truth for metrics
November 12, 2020
The Enterprise Monitoring project conducted an extensive proof of concept (PoC) with three vendors this past winter. After evaluating feedback provided from all ITS departments and involved IT partners, we announced in the spring that Dynatrace was selected as Yale’s core Enterprise Monitoring system. Implementation of Dynatrace began on July 1 with the onboarding of a Dynatrace Guardian, Product Specialist, and Success Manager, followed by a week of Dynatrace Quick Start training (recordings available on the Enterprise Monitoring Sharepoint site; login may be required).
Over the past three months, the project team has deployed and configured Dynatrace to 172 machines representing 87 applications. With Full Stack and Digital Experience Monitoring (DEM), every component, transaction, and event is captured and analyzed for performance by an artificial-intelligence engine that automatically alerts teams of potential issues and impact. In addition to monitoring applications, Dynatrace has been connected to VMware, Docker Swarm, AWS, Azure, BigIP F5, SNMP, Oracle, and many other technologies for which performance measurements are constantly being collected across thousands of devices.
The implementation strategy consists of five phases, during which Dynatrace is deployed in priority order to an applications designated Tier Level. During Phase three, occurring between October and December and before Tier Level 2, the IT partners are engaged for critical production applications. The largest deployment phase occurs between December and April 2021 during which Tier 2 applications are instrumented.
With Dynatrace at the core of our solution, system and application owners now have a single source of truth for all metrics and a single pane of glass to view those metrics. Information is now more broadly shared across departments, enabling better collaboration when troubleshooting critical issues. To facilitate faster mean time to resolution (MTTR), work is underway to build out integrations with incident management tools like ServiceNow Incident Management, operations management tools like ServiceNow Configuration Management Database (CMDB) and Event Management, as well as communication platforms like PagerDuty, Microsoft Teams, and Slack. With so many integrations supported by Dynatrace, we are able to create a durable Enterprise Monitoring fabric that teams can depend on.
Please join us every Thursday, from 2:00—3:00 p.m. during a Dynatrace coaching session, or every Tuesday, from 11:00 a.m.—noon, during a Dynatrace enablement session, to learn more about this amazing solution, ask questions for those already implemented, or ask how to schedule an implementation to your applications. ServiceNow tickets and incidents can also be opened for basic inquiries or troubleshooting help/support, via the Enterprise Monitoring service offering page.